


With the Publication of the Draft List for the 2026 Revaluation, John Webber of Colliers assesses who are the winners and losers and urges businesses to check their new RVs- as they still have it all to play for.
The Government’s draft rating list for the 2026 Revaluation, published hot on the heels of the Autumn Budget reveals that there are few winners in rateable value (RV) terms from the new list, with many sectors seeing significant rises, primarily because the last list was based on the low 2021 rental values influenced by Covid.
But according to John Webber Head of Business Rates at Colliers, there are still large discrepancies in the List. As a result, many companies should consider approaching the Valuation Office Agency before the list becomes live on 1 April 2026.
According to Colliers the biggest winners from the list were film studios who saw their RVs reduce by 26.7% and who will also still receive reliefs, which have been extended to 2034. The biggest “losers” seeing steep RV rises appear to be the Civil airports whose RVs have increased by 295% in the new list, closely followed by Royal Palaces who saw increases of 201% , although these increases will be capped by transitional relief.
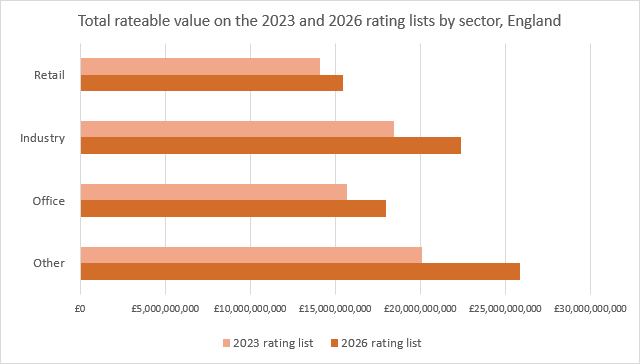
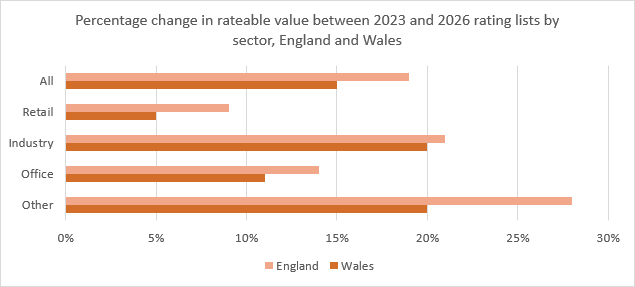
Overall, the 2.13m properties in the local rating list in England and Wales have increased by 19.2% seeing cumulative RVs go from £70.78bn to £84.4bn. England seeing an overall increase of 19.4% and Wales 15.2%.
The biggest overall increase in RV in England was seen in London at 22.3% and the smallest increase in the East Midlands at 16%. Even smaller was Wales at 15.2%.
In terms of sector, the ‘retail’ sector saw the smallest increase across England and Wales at 9.3%, the ‘Industrial’ sector saw increases of 21.1% and the ‘office’ sector is up 14.3%. The ‘other’ sector which are the property types outside the bulk classes of retail/office and industrial saw an increase of 28.2%.
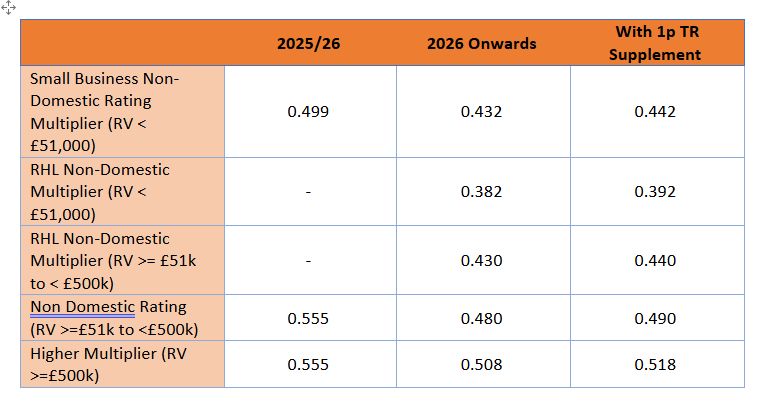
Whilst we’ve seen an increase in RVs, we have seen a reduction in multiplier rates in England (although there has been an expansion of the number of different multiplier categories). The non-RHL (Retail Hospitality and Leisure) multipliers have reduced by 13.4% (small) and 13.5% (standard). The table below illustrates the new levels.
Ratepayers have protection from large increases via Transitional Relief capping increases to between 5% and 30% depending on whether it is a ‘small’ ‘medium’ or large property.
Elsewhere in the major sectors:
Loser: Industrials
Operators of large warehouses and logistic/distribution space will see some big jumps in their rates bills when the new Revaluation comes into force next April. The Total Rateable Value in this sector in England jumped from £18.5bn to £22.4bn – an increase of 21.1%.
In addition, in most cases, they will be paying the higher multiplier of 50.8p plus 1p (transitional supplement) – so they can expect large increases in their bills from next April.
The table below shows examples of where the Rateable Values have increased on some of the highest quality industrial and distribution space in the country. The average RV increase for the industrial sector is 21.1%, the highest being in the Northeast at 25.1% with the lowest being East Midlands at 18.2%.
| Location | Percentage Change in RV |
| Magna Park, Midlands | 28% increase |
| Stakehill Industrial Estate, Manchester | 21% increase |
| Symmetry Park, Bedfordshire | 30% increase |
| Blossom Way, Hemel Hempstead | 22% increase |
| Trafford Park, Manchester | 35% increase |
| Western Approach Distribution Park, Bristol | Between 10% to 14.5% increase |
| Magor, Wales | 25% increase |
| Europa Way, Sheffield | 40% increase |
| Pattinson Industrial Estate, Tyne & Wear | 33% increase |
While there will always be regional variations to a degree, the fact that some have increased by 10% and others by 40% is either because they were too high last time or too high this time. Or possibly both!
Loser: Prime Offices
In general, rateable values have risen in the office sector but not quite to the same extent as the industrial sector. RVs adopted on city centre offices have in the main increased across the country, with the levels of increase varying depending on the location (with prime offices showing the greatest rises.) In England RVs for offices have increased from £15.7bn to £18bn – an increase of 14.4%. In Inner London the rise was from £8.5bn to £9.7bn – an increase of 14.1%. Of all the London boroughs Camden in particular saw a big jump with RV’s rising from £932m to £1.14bn – a massive increase of 22%.
The table below shows some of the rises in prime city centre office stock across England and Wales.
The average RV increase for the office sector is 14.3%, the highest being the Southwest at 19% with the lowest being East Midlands at 5.8%. Serviced offices have increased by 21%.
| Location | Percentage Change in RV |
| Wellington Place, Leeds | 37% increase |
| Spinningfields, Manchester | 21% increase |
| York Street, Manchester | 5% increase |
| Colmore Row, Birmingham | 29% increase |
| Cheapside, London | Between 5% to 22% increase |
| Victoria Street, Bristol | Between 40 to 47% increase |
| Central Square, Cardiff | 15% increase |
For City Offices the vast majority (69.3%) of offices valued at over £100,000 saw increased RVs by between 5% and 15%. There are some notable inconsistencies in the draft list, with the RV for one property increasing over 49%, while the RV for a property around 100m away on the same road has remained the same. Roughly half will see increases in liability because of the changes in rateable value, some because of the addition of the ‘higher rate multiplier’ bracket. There are some big losers who will feel the impact of some significant increases and the super multiplier all at once.
Again, the lack of consistency is striking. The VOA may argue that they are merely following the rental evidence they have at their disposal but given the data sets at their disposal it would seem that a computer programme has carried out these valuations and the experienced valuer standing back and looking to see how these values look has been consigned to history, or they are picking up their pension!
In key Central London markets as a whole, although rateable values have generally increased; in terms of liability the general theme is one of inconsistency with some big changes in certain markets – particularly Mayfair, Kensington and Fitzrovia where bills look to increase by 33%, 29% and 24% respectively and more modest ones elsewhere, with 15 boroughs showing rates increases of less than 10%.
There are also some submarkets such as Farringdon and Shoreditch where we were expecting much more significant increases based on the AVD rental evidence. The rebasing of the multiplier has also meant some liability falls such as in Canary Wharf, Marsh Wall, East City/Aldgate Shoreditch, London Bridge and Vauxhall/Battersea. Overall properties in eleven of the 28 boroughs will still be paying rate bills of more than £40 p sq ft though.
Mixed Winners and Losers: Retail
Unlike in the last list, the retail sector in England has on average seen an increase in Rateable Value (RV) with retail in England increasing in value by 9.3% from £14.1bn to £15.4bn. The biggest rises were seen in Inner London seeing a 14.5 % increase in RV, with variants between the boroughs. Retail RVs in Westminster for example saw an increase of 12.1%, but Tower Hamlets saw a massive 22.4% jump, probably due to redevelopment such as at Wood Wharf.
In terms of region, the average RV increase for the retail sector is 9.3%, the highest being London at 13.2% with the lowest being the Northeast at 2.5%. The Northwest saw increases of 6.2%, Yorkshire and The Humber 7.6%, East Midlands 9.2%, West Midlands 10.3%, Southeast 9.7%, and Southwest 6.8%.
The below is a comparable of major shopping districts across the country.
| Location | Percentage Change in RV |
| Oxford St, London | Between 2-20% decrease |
| Sloane Street, London | 35-46% increase |
| Westfield, London | 0-26% increase |
| Bull Ring Birmingham | 8% increase |
| New Street, Birmingham | 13% increase |
| Manchester Arndale | 0-10% increase |
| Manchester Trafford Centre | 0-20% increase |
| Cabot Circus, Bristol | 24% increase |
| Northumberland St, Newcastle | 4% increase |
| Davygate, York | 36% increase |
| The Moor, Sheffield | 9% decrease |
| St David’s, Cardiff | 6% decrease |
In the Northeast, the changes in RV vary from location to location, High Street to High Street with no real clear trends.
There is a clear trend in the centre of London which has seen a general rise in values, with some reaching almost 70%.
In the South we’ve seen prime retail values fall with some towns (Reading, Peterborough) in the South and Southeast see decreases in RV reaching 45%. In Manchester we have seen a number of increases in RV in both primary and secondary locations- seeing rises between 10-20%.
Although retailers with an RV of under £500,000 will benefit from the lower RHL multipliers which were announced at the Budget, there has been concern that the 5p discount for the small RHL multiplier (now at 38.2p) is not as low as it could have been given the government guardrails allowed a 20p reduction. Since many of these properties will fully lose their RHL relief next April, it is questionable whether this discount will be enough to counter the loss of reliefs, particularly with rateable values rising.
The government has announced a ‘Supporting Small Business Scheme’ for those who lose RHL which will cap those bills at an increase of £800 per annum – this is aimed at the smaller retail / hospitality businesses. Therefore although the reduction could have been greater, there is some protection from any steep rises. However, this scheme is expected to be limited for national retailers.
It is worth noting that last year retailers enjoyed a 75% discount before it was reduced to 40% in 2025 – so the increases many independent retailers will have experienced over a two-year period will be significant.
Meanwhile the government has announced the higher multiplier on properties with an RV of £500,000 or more, including in the RHL sector. Colliers believe 34,80 retail properties fall into that category- who will now see their RVs increasing by 10% to a total RV of £4bn.
Again, the level of the multiplier is crucial in determining bill rises. There was some relief that level of the higher multiplier was not as high as expected – at 50.8p, it was a modest 2.8p increase (it could have been 10p more at 58.0p). Even with the additional 1p surcharge, many of these properties will be seeing a lower multiplier than they did previously and in some cases their rates bills could drop.
We have drilled down to look at the food stores. According to our estimates a number of the bigger food stores on the largest sites will see RV increases of 5.8% but their multipliers will drop from 55.5p to 51.8p (where the 1p supplement applies)- a 6.7% drop – so some of the biggest stores could be 1% better off.
The overall picture for retail is therefore one of general relief that the surcharge could have been higher and the rateable values increases have generally been modest.
Retail across the England has gone up by 9.3% but those that were paying the higher multiplier of 55.5p today will in many cases be paying the standard RHL multiplier next year of 43p plus 1p so a reduction of circa 2.2%.
Of course, retail also use logistics facilities, which have seen much larger increases and in most cases will be paying the higher multiplier of 50.8p plus 1p (transitional supplement).
Loser : Hotels
Hotels have generally lost out from the Revaluation – with Rateable values going up by 76% across the country. This has resulted in some startling rises particularly in the major cities as the table below shows.
We’ve seen RVs for 4 Star (and above) hotels increase by 97%, 3 Star (and below) by 37% and Country House Hotels by 22%.
| Hotel | Increase in RV |
| Leonardo Royal Hotel, Birmingham | 79% increase |
| Holiday Inn, Bristol City Centre | 160% increase |
| Premier Inn, Cardiff City Centre | 259% increase |
| Dakota Hotel Leeds | 153% increase |
| Premier inn Manchester Central hotel | 267% increase |
| Hilton London Angel Islington | 113% increase |
| Residence Inn by Marriot W London | 197% increase |
| The Headland Hotel and Spa Newquay | 7% increase |
| Premier Inn Newquay | 1% decrease |
We are also seeing significant increases across the board in rates payable. As we expected the large cities are being affected the most, with some hotels seeing steep rises – some hotels paying 150 or 200% more in bills. However some seaside locations like Cornwall are actually decreasing.
While increases are not unexpected, some of the increases do not appear to be an accurate representation of value and thus may present some appeal opportunities.
Biggest Losers
The ‘other’ sector, which includes education (schools, universities), health (hospitals, clinics), transport (airports, bus stations), leisure (bowling alleys, football stadia, museums) accommodation (hotels, holiday centres) and utilities (nuclear power stations, sewage works) has seen the biggest overall RV increase at 28.2%, the highest being London at 44.8% and the lowest being Yorkshire and the Humber at 20.1%.
We’ve seen RVs for car parks increase by 36%, advertising rights by 32%, pubs by 30% and holiday homes by 23%.
Conclusion
John Webber concludes, “There is a common theme on the draft 2026 Rating List – inconsistency and confusion. The 2023 Rating List had a valuation date of 1st April 2021. In reality, as it was sat in a covid lockdown period when many businesses were actually prevented from opening, these values are built on a lack of evidence. As the 2021 Rating List was postponed because of covid, which had a valuation date of 1st April 2019 and had largely been completed before being shelved, the 2023 Rating List was in effect a fudge on that list that never saw the light of day. As such the base of the 2023 Rating List is built on sand and this is at the heart of the inconsistencies we are seeing on the draft 2026 Rating List.
Our advice to businesses is: Get appealing your 2023 Rating List entry before even looking at 2026!”